// PROJECTS
Projects by Role Fit
A focused set of projects for Data Engineering, Analytics Engineering, BI reporting and automation roles. Use the filters to quickly match the evidence to the role you are hiring for.
// DATA ENGINEERING & ANALYTICS ENGINEERING PROJECTS
Data Engineering & Analytics Engineering Projects
Pipeline, modelling, quality and reporting-layer projects for operational and analytical datasets.
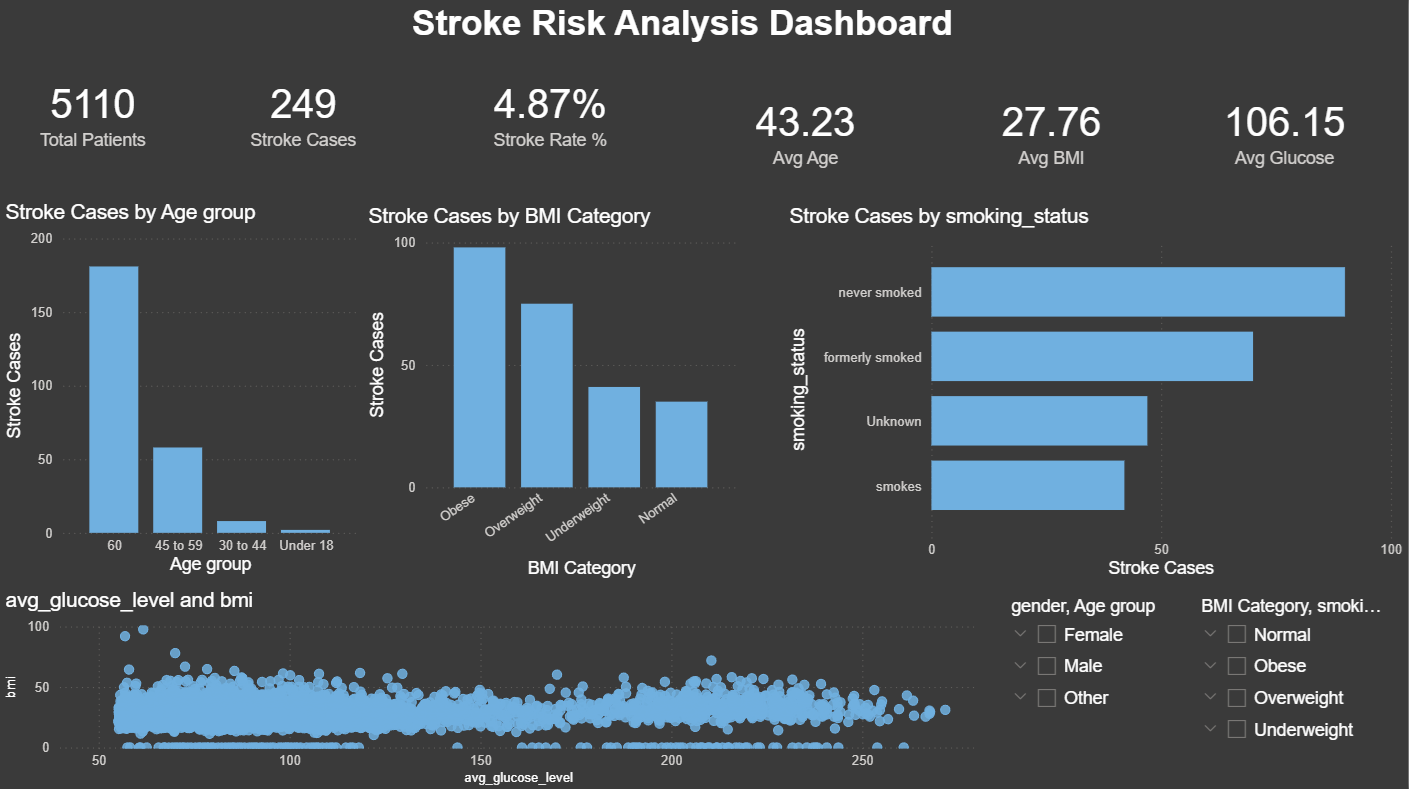
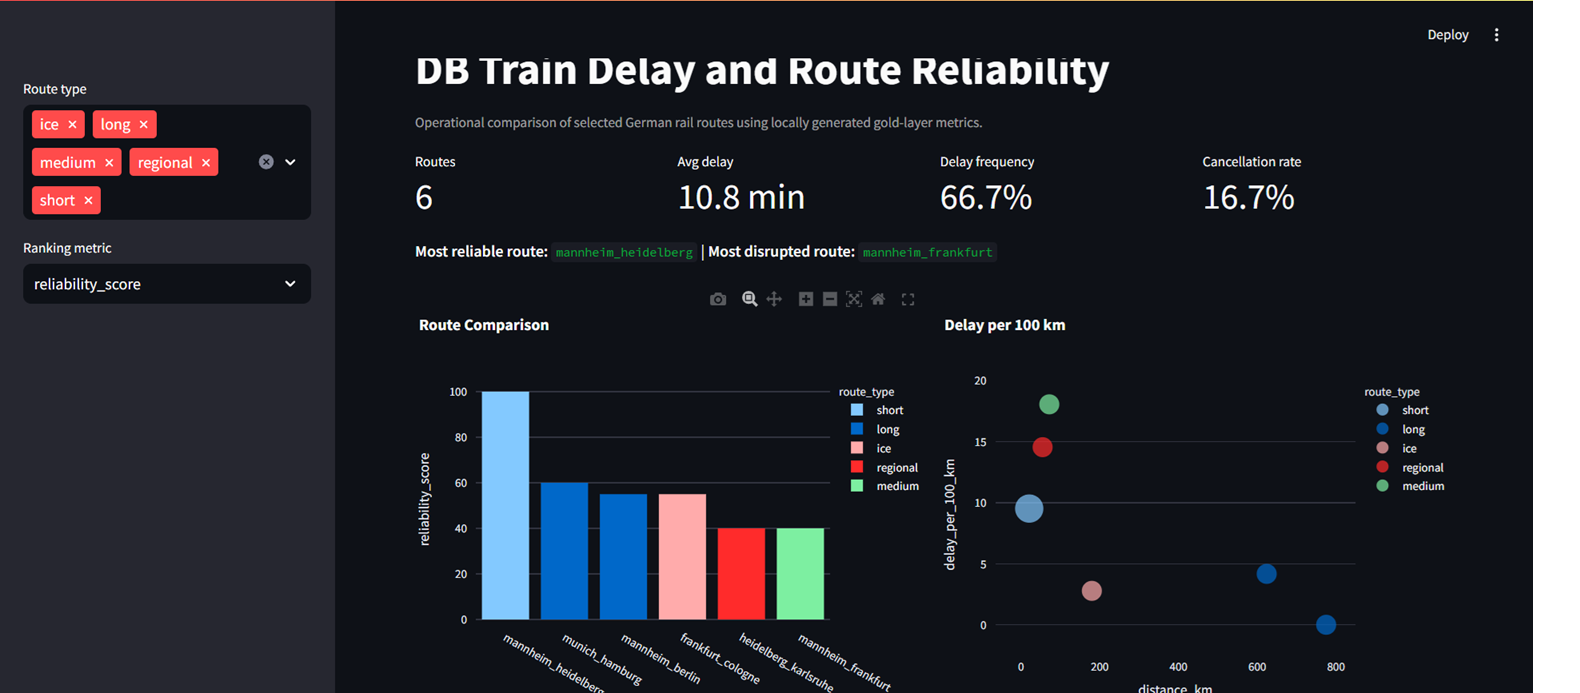
// BI & DATA ANALYTICS PROJECTS
BI & Data Analytics Projects
Dashboard, KPI and exploratory analysis projects for business-facing reporting.